Getting Started#
This workflow will guide you through the core functionality of Forester’s editor. It illustrates our approach to building plots interactively and at the same time exploring your model.
Our goal is to build a tree that illustrates what split features are relevant, how they affect the distribution of classes and how leaves in the tree compare with each other. All at the same time. Quite a lot to do with one plot, but you will see that it is quite easy with Forester!
All functionality is described using the example Fisher’s Iris. Of course you could follow this workflow with any other project, too. But for a start it is probably best to stick to a small and easy model. So go ahead:
Open the Project
Please open the example Fisher’s Iris from the project dashboard.
Obtain an Overview#
Forester’s editor is designed as lightweight as possible. In the center you see a classification tree for Fisher’s Iris data. Each node in the decision tree represents a subset of the training data. For internal nodes, the training algorithm assigned a feature split, e.g. a threshold to partition the dataset. For leaf nodes the algorithm decided that it is sufficient not to add another split.
In the header you find Forester’s logo. It guides you back to the project dashboard when you click on it. Additionally, you find links to the GitHub repository, the documentation (that you are reading now) and our work at the University of Potsdam.
There is a lot to explore, but we start with something small and very important - the hint panel.
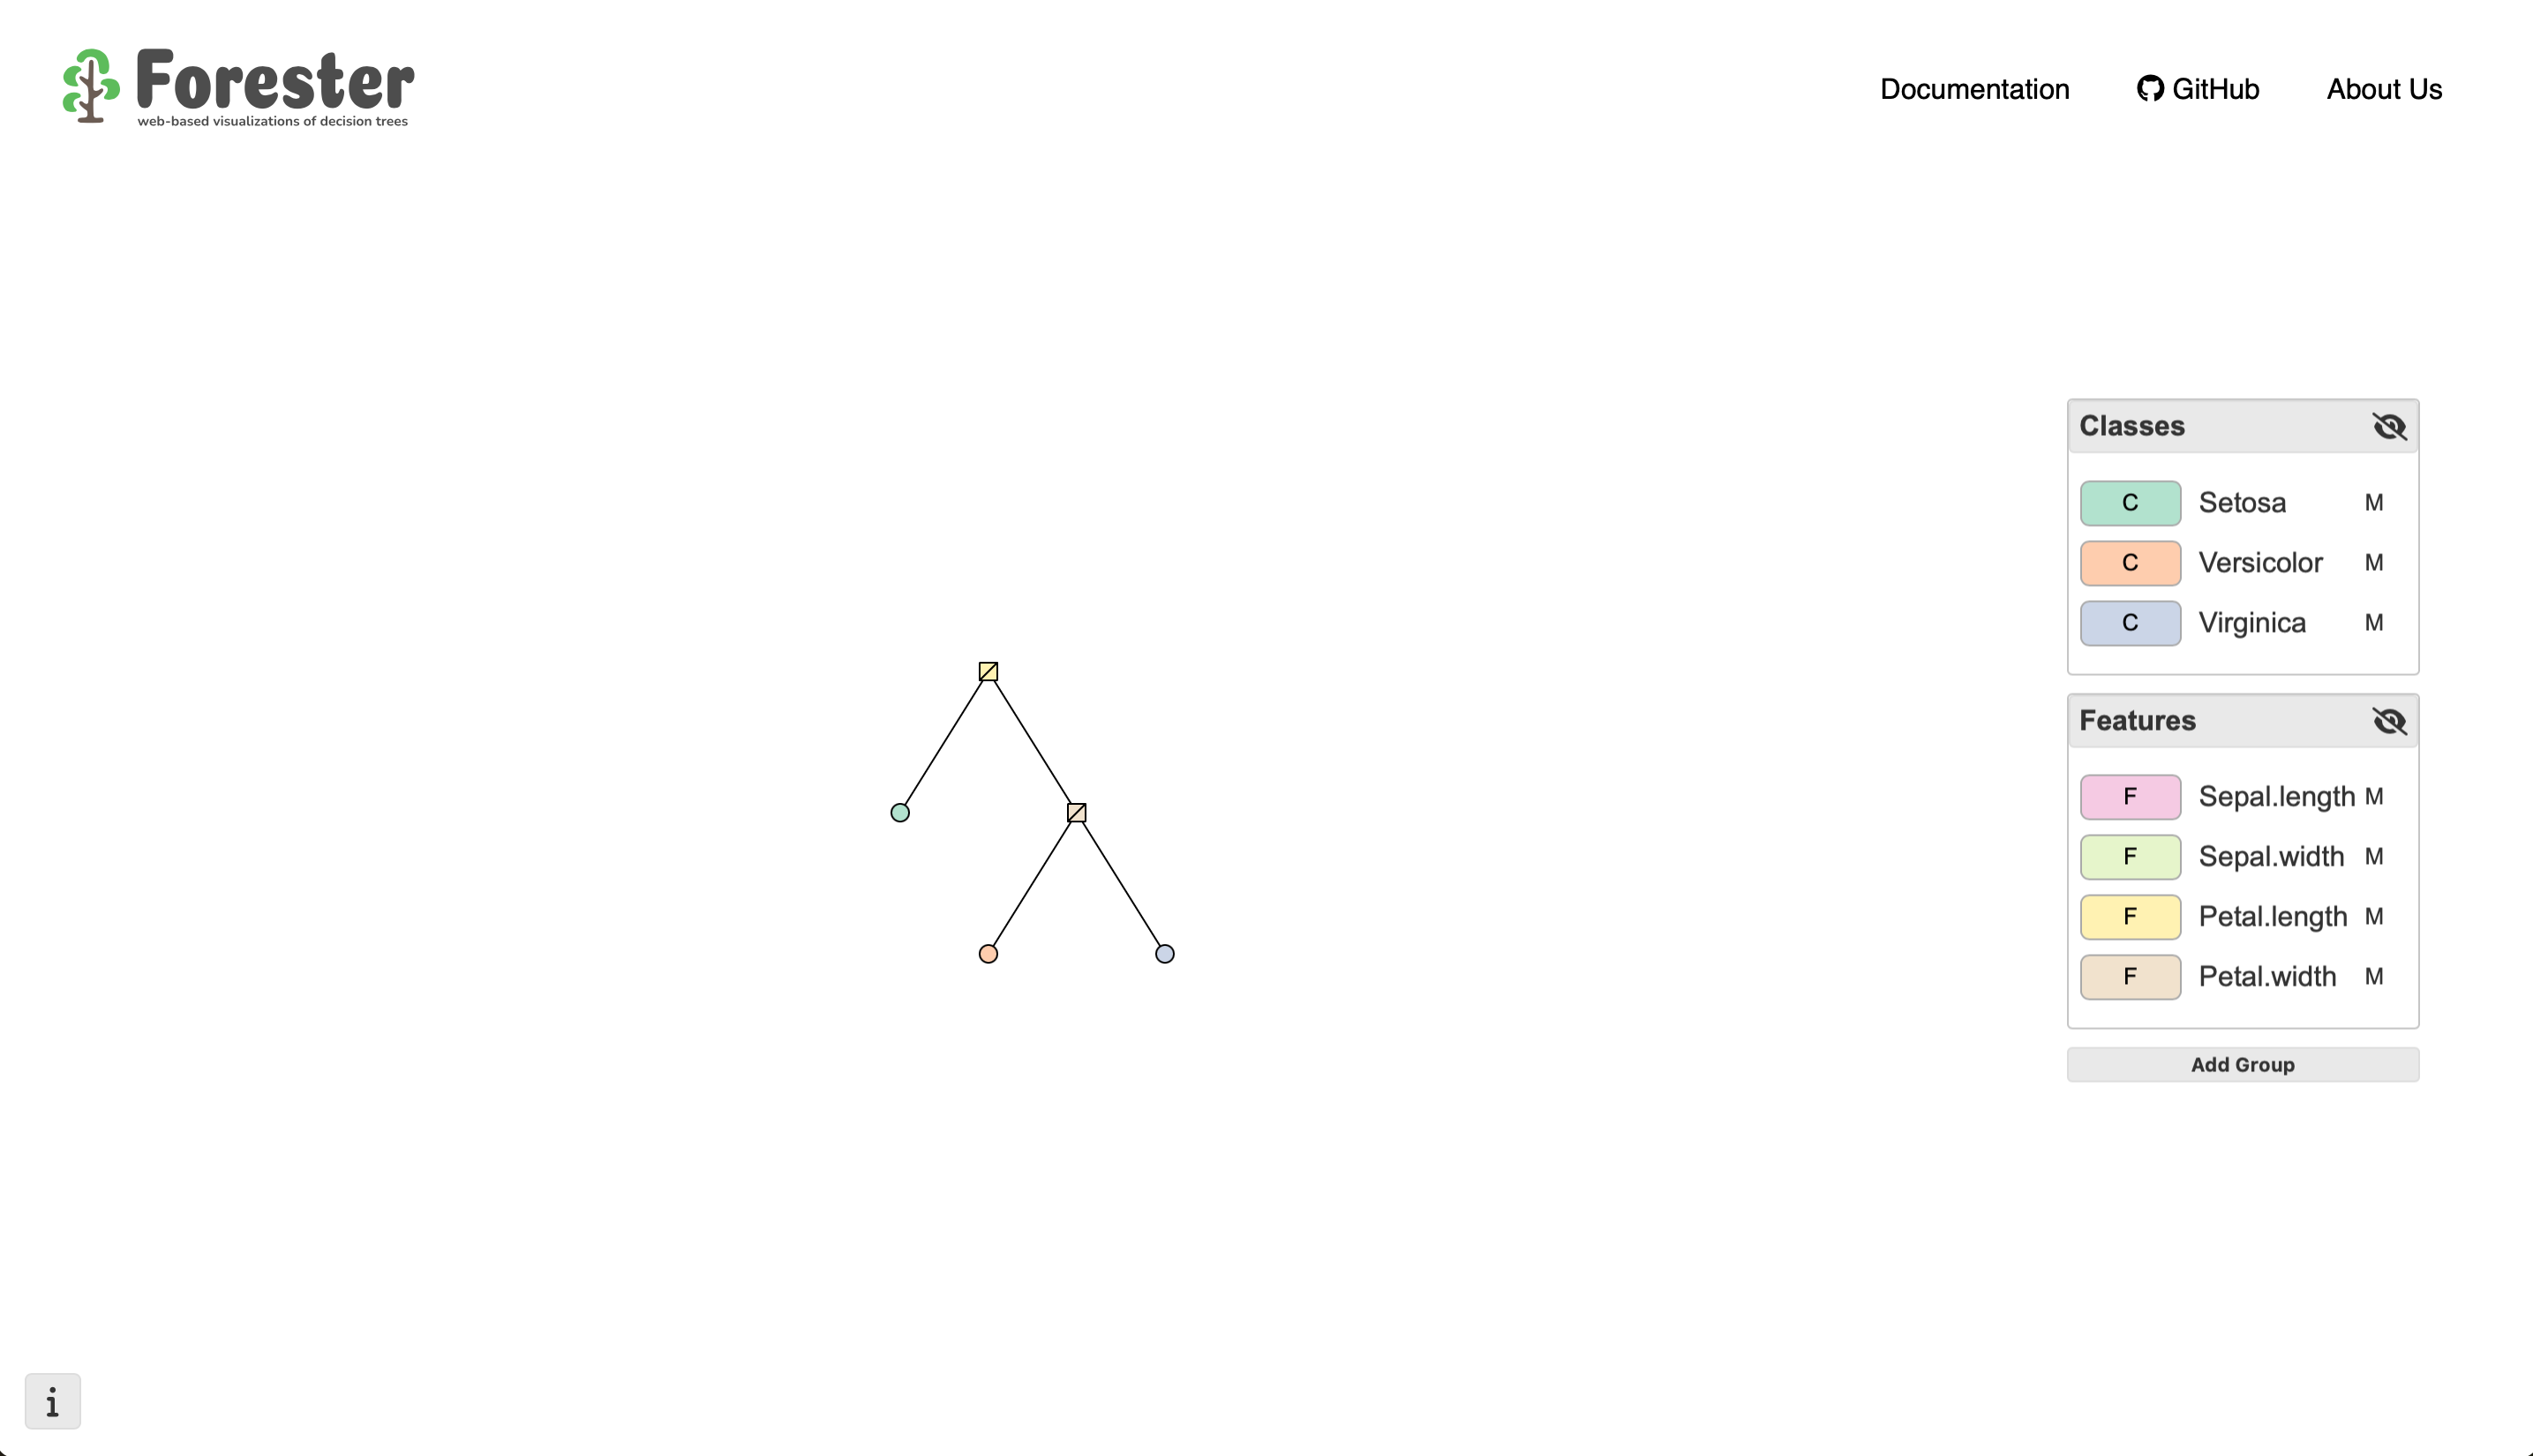
Fisher’s Iris Classification Tree in Forester’s Editor
Hints#
Move you mouse around. When you hover over certain elements of the user interface a hint panel opens up automatically. It displays some information on their functionality and how they could help you with model interpretation.
The hint panel opens automatically when you hover over a hinted element and closes after five seconds. When you find this annoying (because you are already an experienced forester) you can disable this functionality by clicking the Automatic button on the upper-right corner. You then need to open and close the panel manually.
Forester’s hint panel helps you getting started.
Legend#
On the right side of the user interface you can see the legend. By default, Forester groups classes and features separately to clearly distinguish them. Colors are assigned based on the Brewer scale Pastel 2. The first color of the scale is assigned to the first class and so on. Once all classes are colored, the assignment proceeds with the features. When there are not enough colors in the scale, entries are colored white.
The color mapping is used all over Forester. You can see this already in the nodes of the tree. The two internal nodes seem to reflect the two features Petal.Length and Petal.Width and the leaf nodes represent classes. But let’s not get ahead of ourself.
Explore what you can do with the legend:
Update the color of an entry by clicking on the colored field.
Highlight a class or feature by clicking on the .
Drag an entry into another group. The small letter in the color selector indicates whether the entry represents a class or feature even when you move it into another group.
Collapse a group by clicking the icon. Notice, how the entries of this group will be colored white.
Highlight Classes
Hide the group Features. If you too think that the class Virginia should be coloured purple, go ahead and do this.
The Tree#
Finally, we will take a look at what is most important: your model.
Forester illustrates classification models using a classical tree representation, where nodes are connected using links. However, in Forester this illustration is interactive.
Move the tree around by clicking and dragging. You don’t need to click on a node or link, somewhere in-between is fine.
Zoom in or out by scrolling with your mouse. The zoom level is limited, so that you don’t loose track of where you are.
Sometimes you may loose orientation. Re-center the tree by double clicking anywhere on the free area. The centering works relative to the other user interface elements, so that no parts of the tree are occluded.
Collapse a node by clicking on it.
At the moment the nodes are illustrated quite simply. For leafs, a colored circle represents the class with the highest number of samples at this node. For internal nodes, a colored box shows the feature that was used to partition the dataset.
This representation is alright, but of course we want to do better. It would be nice to additionally see the value at which the split was done and the whole class distribution, not just the vote.
You have probably already noticed, that a small context menu opens up when you hover over a node. From this you make all the changes that change the illustration of nodes.
With the two arrows and you can cycle through different illustrations for one node. We call them views, as they allow you to see a node from different perspectives. They all highlight their own aspects and of course not all views are applicable for all nodes: for leaf nodes you can not show split values. There is a whole page dedicated to the different views and node illustrations.
The icon is used to change node specific settings for the illustration. This will be described in a later section.
Change the Views
Change the views of the internal nodes to give more information on the split feature and location and the leaf nodes to represent the class distribution.
Cycle through views to highlight different aspects of the node.
Settings#
Open the global settings by either pressing Esc or using the button. In the opened dialog you can change settings that affect the whole tree.
The tree is updated whenever you change an option. However, changes are lost when you close the settings again. You can update the settings permanently by clicking the submit button.
Settings are grouped into three categories:
Under Legend you can change the default colorscale of the legend. Note, that this overwrites the colors of you entries and can not be reverted.
Layout settings affect the placement of the nodes. Level and branch space change the distance between nodes on the same level or branch. The option dendrogram places all leaves along one line.
The path settings change the style of links that connect nodes. You can update the shape of the links and encode information on the sample number with it. The option linar scales the line thickness with the sample number. Scaled does so too, but applies a scaling to equalize sample numbers with different magnitudes. With colorcoded enabled, the link is split into multiple lines whose thickness and color represent the classes that flow along this link.
Change the Global Settings
Place all leaves on one level for easier comparison. Enable flow color-coding to see how the class distribution is affected by splits.

Node Settings#
Each view can hold it’s own settings that are unique to the node.
Click on the icon in the node context menu to open the node specific settings. The settings that are displayed of course depend on the currently employed view and the selected node. You can read more on the individual fields in the section on views.
Previously we asked you to change the view of all leaves. You probably did this by hand and are now quite annoyed. Wouldn’t it be nice if you could just change settings or views for a set of nodes?
At the bottom of every node settings panel you see a field called “Apply to”. With this you can control to what nodes the settings change is applied. When you apply view-related settings to a node with a different view, it’s illustration is updated. This is therefore another way to quickly change the views of many nodes at once.
With this selected, the change is just applied to the node on which the settings have been opened.
With view selected, the change is applied to all nodes that currently use the same view.
With position selected, the change is either applied to leaves or internal node for which the settings have been opened.
With subtree selected, the change is applied to the selected node and all it’s descendants.
With all selected, the change is applied to the whole tree.
Note, that changed settings are previewed on the node for which the settings have been opened regardless of the selection to which they should be applied. Without submitting the new settings, the values are reverted.